I have a confession to make. I am a big fan of Doug Noland’s Credit Bubble Bulletin. His weekly macroeconomic blog astutely details the evolving monstrosity that is our Frankenstein bubble economy.
In one of his recent posts, Mr. Noland dissected the Federal Reserve’s Q4 2017 Z.1 Flow of Funds report. What I found particularly fascinating was the way he compared historical total U.S. securities outstanding to total U.S. GDP. I will quote him below:
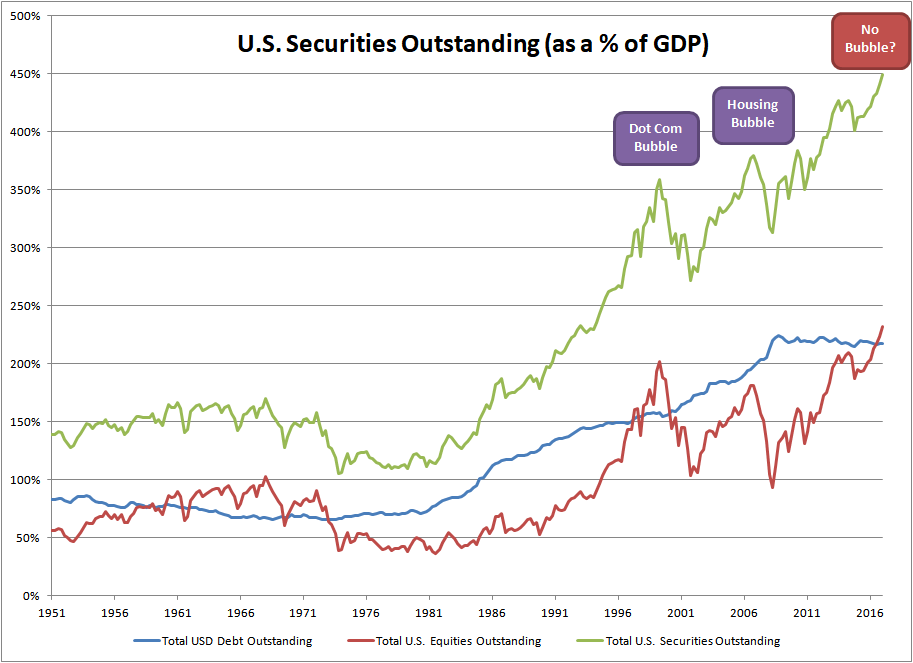
Total (Debt and Equities) Securities ended 2017 at a record $88.651 TN. Total Securities surged to a record 449% of GDP, up from 429% to conclude 2016. For perspective, Total Securities to GDP peaked at 379% ($55.3TN) during Q3 2007 and 359% ($36.0TN) at cycle highs in Q1 2000. Total Securities as a percent of GDP ended 1970 at 148%, 1975 at 122%, 1980 at 128%, 1985 at 155%, 1990 at 189%, and 1995 at 262%.
His analysis was so intriguing that I resolved to independently replicate the data using Federal Reserve data. You can see the fruits of my labor in the chart above.
It shows the combined market value of all U.S. securities outstanding (both debt and equity, which are also broken-out separately) charted as a percentage of U.S. GDP since 1951. If you want to know why I believe we are currently living through the largest bubble the world has ever known, well, this is it.
All the data for this chart comes directly from the Fed. It uses the L.208 Debt Securities table and the L.223 Corporate Equities table from the Fed’s Z.1 report, in addition to GDP values from the FRED database.
The implications of the excessive amount of U.S. securities outstanding should be terrifying to every investor, saver and entrepreneur out there. It indicates that combined U.S. debt and equity assets have to take a 66% haircut to get back to pre-1990s “normal” levels of 150% of GDP. Even if you assume that a permanently elevated level at 200% of GDP is warranted, anything less than a 50% across the board loss is unrealistic.
1/4 Troy Ounce Gold Bullion Coins for Sale on eBay
(This is an affiliate link for which I may be compensated)
Not only does the U.S. securities outstanding chart clearly show prior bubble peaks, but it also shows the reasoning behind why they are bubbles. All securities ultimately “pay-out” via GDP. When you sell a security to fund your retirement or buy a new car, you are, in effect, exchanging that stock or bond for current goods and services – in other words, GDP.
Because of this, it is reasonable to assume that an economy can only support a certain level of aggregate security value in relation to GDP. Situations like we have today, where we are clearly above that level, do not spell imminent economic doom of course. But it does make for a very unstable financial system.
The situation is a lot like an old-fashioned bank run. As long as no one tries to exchange their overvalued securities for real goods and services, everything appears to be fine. But this is an illusion – the calm before the storm.
In reality, the economy can’t cover all the claims against it. The ultimate winners are the first people to exchange their overvalued securities for real goods and services (or something else that will hold its value, like tangible assets).
Everybody who tries to cash out later will find that there is little or nothing left for them. These are the losers in our scenario. Can you imagine what it will look like if almost every 401-k, IRA and brokerage account across the country takes a 50% to 70% loss within a few short years? This is exactly what could happen when our present bubble eventually bursts.
This is why I advocate investing in hard assets, such as fine art, antiques and precious metals. These underappreciated assets haven’t experienced the same ruinous bubble dynamics that paper assets like stocks and bonds have. As a result, tangible assets should hold their value admirably in the coming bubble reversal.
Read more thought-provoking Antique Sage investing articles here.
-or-
Read in-depth Antique Sage investment guides here.