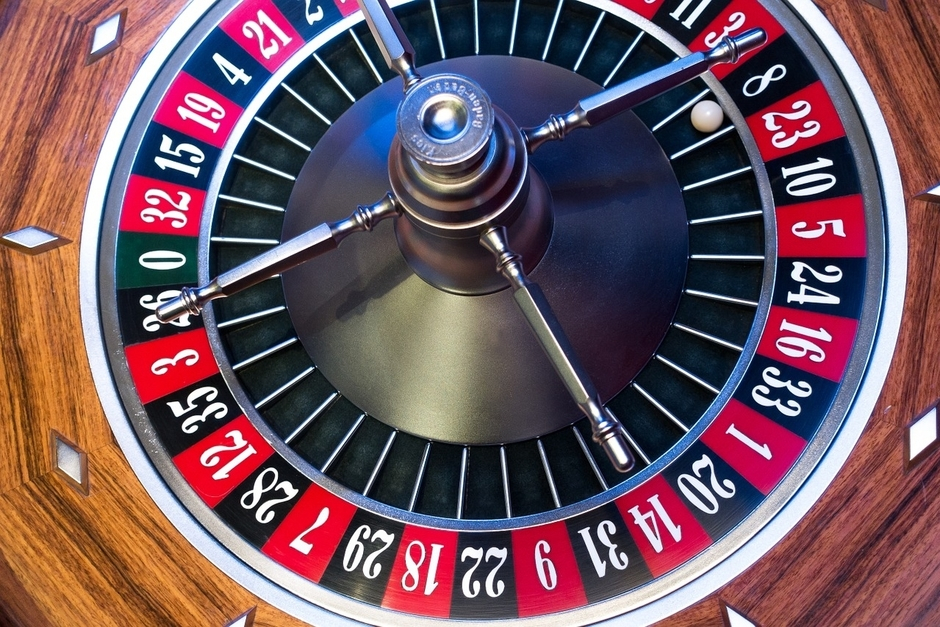
We’ve all heard the old stockbrokers’ adage that equities always appreciate at 10% a year – give or take. Unfortunately this myth has been repeated so often that many people believe it is a universal Truth. Every year millions of us dutifully cram whatever money we can afford into our retirement accounts and invest in stocks, hoping against hope that we at least come close to that magical 10% annual return.
Unfortunately, reality can be a brutal place. Stock returns over the next couple of decades will most likely end up barely positive, in the 0% to 3% range per annum, rather than the 10% we’ve all built our future dreams upon. As a consequence, many ordinary people will undoubtedly find themselves working until the day they die instead of retiring comfortably as they originally hoped.
I understand that saying stocks will do badly over the next decade is a rather dire prognostication. So what is the evidence for it? The major predictor I use is a modified valuation formula shamelessly borrowed from deep thinker and asset manager John Hussman of the Hussman Funds:
((1+Nominal GDP Growth Rate)*(Average Valuation Metric/Current Valuation Metric)^(1/Number of Years))-1+Current Dividend Yield
In this case I like to use the S&P 500 Index as being representative of broad market averages. I also like to use the price-to-sales ratio as my chosen valuation metric. Not knowing what the future holds, I have created a baseline scenario and a wildly optimistic scenario. Keep in mind that these potential return calculations only work over longer (more than 5 year) periods of time. The stock market could easily rise or fall by double digits next year and it wouldn’t invalidate these calculations in the least.
If you plug in all the variables you get something like this for the baseline scenario:
((1+4.0%)*(1/1.81)^(1/10))-1+2.12% = 0.13% S&P 500 return per annum
And here is the wildly optimistic scenario:
((1+6.3%)*(1.41/1.81)^(1/10))-1+2.12% = 6.69% S&P 500 return per annum
Of course there are a lot of assumptions buried in these predictive formulae. For one thing, it is predicated on today’s dividend yield being a reasonable proxy for dividends several years from now. That might – or might not – be the case because dividends can increase, decrease or even be suspended.
Another sizable assumption is the nominal growth rate of the economy over the next decade. First we’re using this number as a proxy for aggregate corporate growth rates, which I believe to be approximately true, particularly over long periods of time. Historically, this rate has been about 6.3% in the United States.
This is the value I use in the wildly optimistic scenario above. However, recent history after the Global Financial Crisis, as well as Japan’s experience during its (ongoing) “Lost Decade” point to a much lower value of no more than 4.0%. I use this lower value in the baseline calculation above.
Now the heart of the matter is the valuation metric used and the assumption that this metric reverts to the mean over long time periods. Today, the S&P 500 has a price-to-sales ratio of 1.81. This value is – to put it charitably – absolutely insane. It is higher than at any point since the original Dot Com bubble around the year 2000. The S&P 500’s average price-to-sales ratio over the last 15 years is 1.43. This is the value used in the wildly optimistic scenario above. If we exclude the Fed induced period of serial equity bubbles over the last 20 years, then a price-to-sales ratio of around 1 would be very generous. This is the average value I use in the baseline scenario.
These formulas also assume that any valuation reversion takes place over 10 years. Returns can be increased or decreased by changing that time frame. Decreasing the amount of time for the valuation reversion depresses returns while increasing the amount of time gooses them.
Now that I’ve explained the voluminous methodology and numerous caveats attached to these formulae, let’s look at the returns themselves. The baseline scenario yields 0.13% over the next decade while the wildly optimistic scenario gives 6.69%. I didn’t bother calculating a pessimistic scenario because I don’t want to be accused of frightening children and kicking puppies. As you can probably guess, it would have a negative sign in front of it.
Now some people might argue that I am not factoring in future inflation. And there is a grain of truth in this accusation. Sharply increased future inflation is not explicitly captured in these calculations. However, I feel sustained, high inflation in today’s debt saturated economy is close to an impossibility. Recent history has certainly served to buttress this supposition. In any case, inflation is not the panacea that central bankers and politician would have us believe.
This is doubly true for equity investors. Elevated levels of inflation tend to severely depress stock market multiples (valuations). The 1970s was a great example of this. The equity markets – while experiencing significant volatility over the period – spent the entire decade going nowhere. Collapsing stock valuations completely offset increased revenue and earnings due to inflation. The only source of return during this period was an indices’ dividend yield. Today, the dividend yield on the S&P 500 is a unappetizing 2.12%. So I wouldn’t rely on inflation to boost your stock market returns.
In all probability, a broad equity market return over the next 10 years of much more than about 3% or 4% is hopelessly unrealistic. This revelation means that you would almost certainly be better off holding corporate bonds rather than stocks – at least if you have a very long investment time-frame. It also means that if you are looking for a place to allocate the risk-oriented portion of your portfolio in hopes of a return greater than 5% per annum, stocks aren’t it!
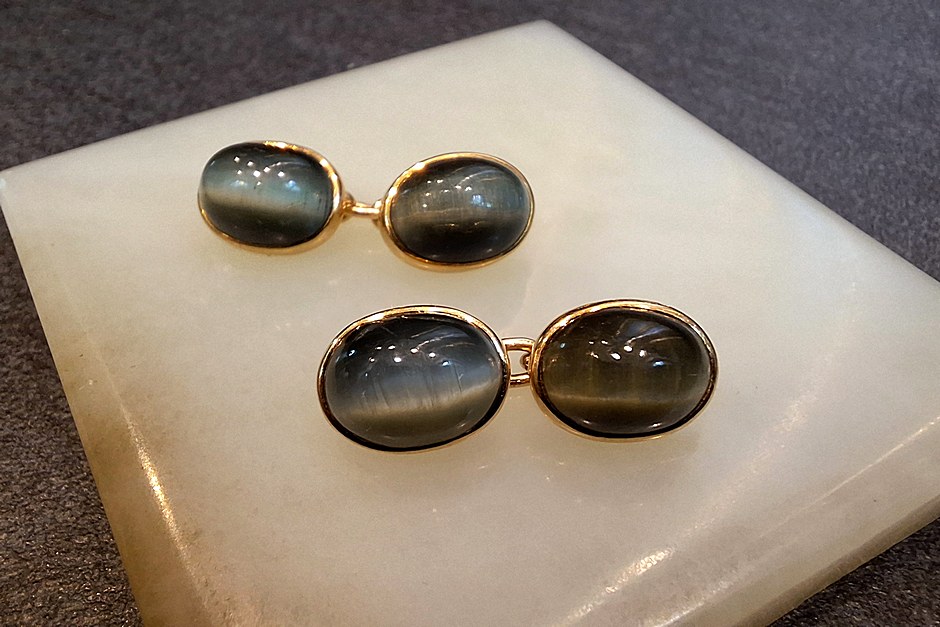
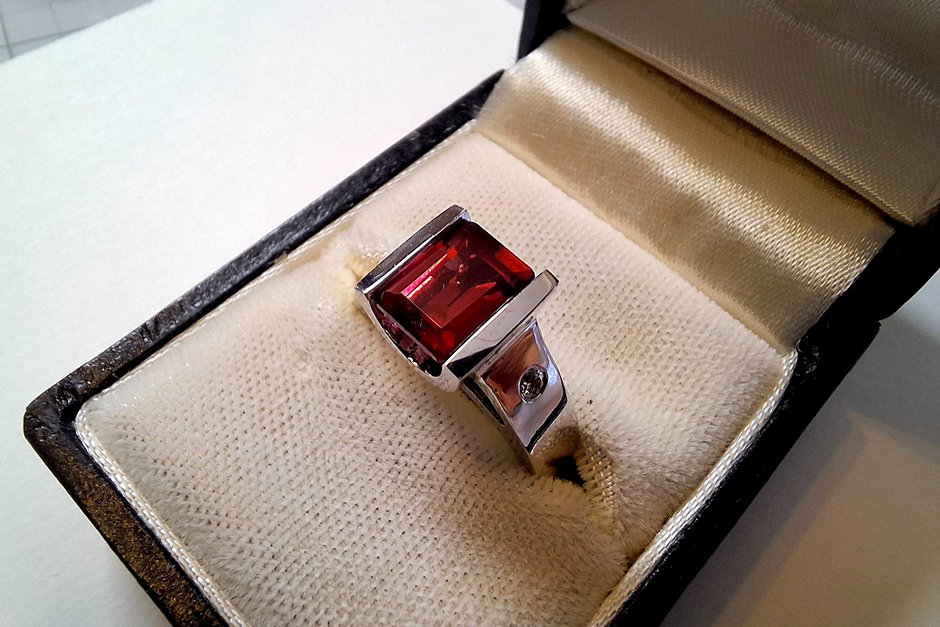
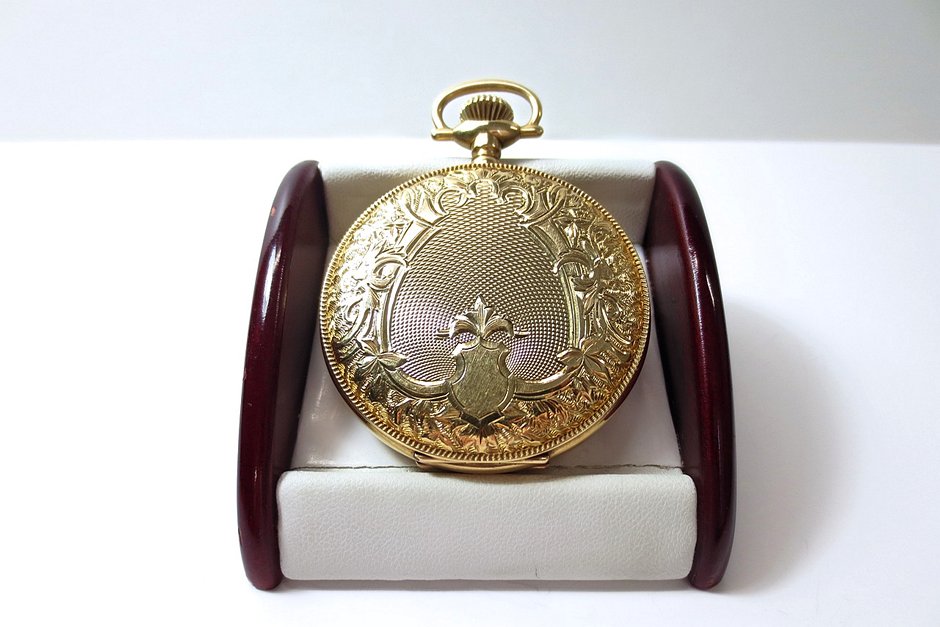
So where can the average investor find a reasonable return in exchange for reasonable risk? Art and antiques are the secret. This little known asset class has so far escaped both the bubble-crazed mad men of Wall Street and the demented policies of central bankers. It represents one of the few remaining islands of value in a sea of investment junk. And with investment-grade art and antiques starting at unbelievably low prices – sometimes as little as $100 an item – you don’t have to be a millionaire to start getting good returns on your money!