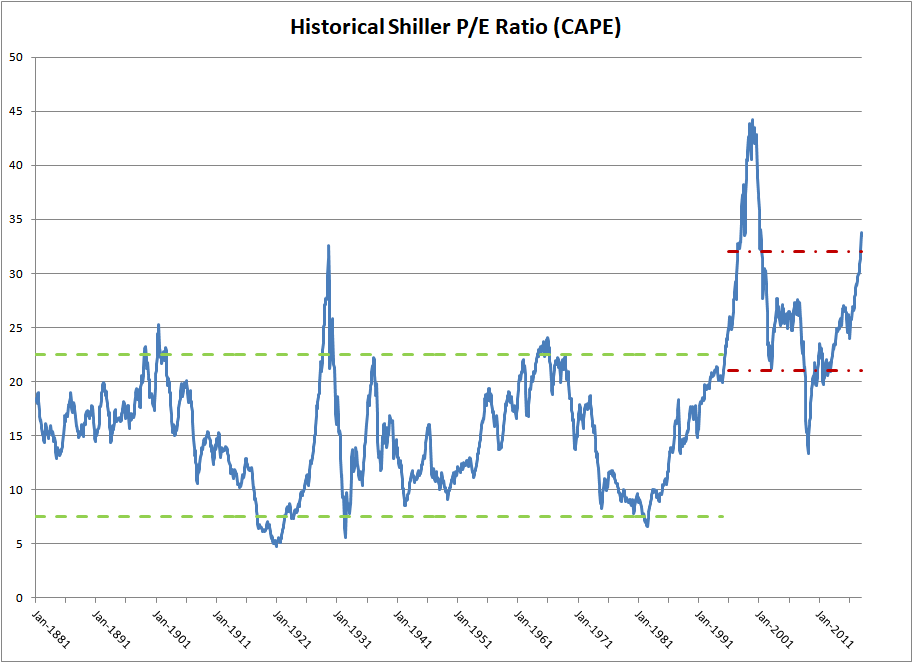
The above graph shows the historical Shiller P/E ratio for the broad U.S. equity market from 1881 through early 2018. The Shiller P/E ratio is also known as the CAPE ratio, which stands for Cyclically Adjusted Price Earnings ratio. This is because the ratio uses the trailing 10 years of reported earnings data in an attempt to remove earnings cyclicality from its calculation.
This last point is so important that it cannot be overstated. Any attempt to measure stock market valuations must take into account the fact that corporate profit margins and, by extension, earnings are highly variable. When the economy is rapidly expanding, companies have pricing power and margins rise. When the economy is mired in recession, pricing power declines, leading to lower profit margins and lower earnings.
If you look closely at the historical Shiller P/E graph, you’ll notice that I’ve added two different bands. The first is denoted by green dashed lines. This reflects the approximate boundaries of undervalued and overvalued markets in the period from circa 1880 to 1995. During this timeframe, stock market valuations rarely declined below 7.5 for any significant period of time. Similarly, valuations spent relatively little time about 22.5.
I think this is largely due to the fact that the stock market during this time was dominated by professional investors. These stock market pros knew that low valuations were good times to buy and high valuations were good times to sell.
In addition, it was an epoch when central bankers were still sane. They knew the boundaries of their mandate and that it was their job to take away the monetary punch bowl just as the party was getting started.
A funny thing happened in the mid 1990s though. Central bankers collectively lost their minds and began wildly inflating securities market bubbles. They decided that there was no problem that easy money could not solve. Global central banks, led by the U.S. Federal Reserve, became activist institutions. They adopted asymmetrical monetary policies which encouraged speculation and the reckless accumulation of debt, while simultaneously discouraging prudence and savings.
In addition, we saw the arrival of the armchair or amateur investor. This trend was driven by millions of workers who were given 401-k or IRA accounts and told to go invest their retirement funds themselves. Most of these people were not financial professionals and didn’t know when to buy or when to sell.
I delineated the modern era of stock market valuations with red dashed lines in the Shiller P/E chart above. During this period, stock market valuations spent most their time much higher than they had historically, bounded between a P/E ratio of 21 and 32.
Interestingly, my analysis of historical stock market valuations does not rely solely on the Shiller P/E ratio for its validity. You could easily substitute a variety of other cyclically-adjusted valuation measures and get basically the same chart. So price-to-revenue, market cap-to-GDP or Tobin’s Q ratio would all work just as well (provided you can find the historical data).
Now the real question for equity investors today is which way will stock market valuations go in the future?
As I see it, there are three possibilities. First, we could ascend to a new, higher range. This would seem to be what the stock market is discounting at the moment, but it implies societal and governmental changes that I don’t think many people would be comfortable with.
For example, I believe higher stock market valuations could be supported if we were to enter a neo-feudal age. In such a scenario, corporations would effectively become partners with the government – especially large tech companies like Facebook, Amazon, Apple, Alphabet (Google) and Netflix. Tax and anti-trust laws would be changed to give these already gargantuan firms even more advantages then they already enjoy today. As a result, their earnings would permanently readjust upward.
This would be a dystopian nightmare for average people. Income inequality would become far worse than it is today, as the rich would get richer and workers would see their salaries stagnate or even decline. Only those people with large equity, business or real estate portfolios would make good.
In the second possibility, stock market valuations would stay within the red dashed boundaries I’ve defined for the modern era. This would be a muddle through scenario, where the global economy continues to underperform while inflation remains largely suppressed. Income inequality would continue to worsen, although not at the same pace as under the first scenario.
Wages would remain weak and corporate profits would continue to grow at a reasonable clip. Most equity investors would be disappointed by this status quo outcome, as it would involve a reversion to the stock market valuation mean that would suppress future returns considerably.
The third possibility would be a return to the stock market valuations of the pre-1990s. Nobody is prepared for this scenario at the moment, which would probably be driven by chastened central banks that reign in loose monetary policies for any number of reasons.
Central banks could have a come to Jesus moment as federal debt levels explode, thus forcing them to confront the negative consequences of their prior feckless behavior. Or it might be revived inflation that finally forces the central bankers to raise interest rates higher than they would otherwise. Central banks might even be compelled to change their longstanding easy money policies due to political changes driven by disgruntled electorates.
In any case, this third scenario would be a catastrophe for most financial assets. Stock market valuations would be cut in half while property and bond markets might not do much better. Many local governments, corporations and pension funds would undoubtedly go bankrupt in this situation.
I will leave it up to the reader to decide which of the three scenarios that I’ve presented is more likely to occur. But I will say this. If you are relying on traditional portfolio diversification to protect your nest egg, you are taking on an extraordinary risk.
Neither stocks, nor bonds, nor real estate is in a position to save you if an average recession, much less a financial disaster, unfolds. This is one of the reasons I like investing in tangible assets, such as precious metals, fine art, gemstones and antiques. They are some of the only assets left that still trade for reasonable valuations.
Read more thought-provoking Antique Sage investing articles here.
-or-
Read in-depth Antique Sage investment guides here.